What's the Right Amount of Bandwidth for your Network to Support Video?

When we hear about video bandwidth it is usually quoted in term of Megabits per second. However, this bandwidth expression can cause problems if it is not accurately understood. It creates an illusion that at any point in time, the bandwidth remains the same (i.e. data and speed is evenly distributed throughout an entire time interval). But, as any good packet capture software can show, this is not the case in real life scenarios. The expression Megabits per second only provides a very coarse and averaged out bandwidth indication over the interval of a full second, but it does not give any details about how that bandwidth is distributed within the full second interval. This information will help you understand when and how packet loss can start to happen on your network.
In general, if we want to find out if the bandwidth is truly evenly distributed throughout a given period of time, we will need to take a closer look at the traffic in shorter periods over the designated time interval. The following information documents how data can actually move on the network and how the average bandwidth representation can be a misleading expression of how data moves on a network.
■ Ideal vs. Actual Data Bandwidth Needs
Let say we have an ‘ideal' network that runs at 100 Mbps. In the table below, each highlighted green cell indicates video traffic that was sent over one second on this network. We would normally describe this group of video traffic as being sent at 50 Mbps for the one second period. This is known as average bandwidth or data speed.
| Total Data for current + all previous time intervals | 50 Mb | |||||||||
| Total Data for current time interval | 50 Mb | |||||||||
| 100 Mbps | 10 Mb | 10 Mb | 10 Mb | 10 Mb | 10 Mb | 10 Mb | 10 Mb | 10 Mb | 10 Mb | 10 Mb |
| 90 Mbps | 10 Mb | 10 Mb | 10 Mb | 10 Mb | 10 Mb | 10 Mb | 10 Mb | 10 Mb | 10 Mb | 10 Mb |
| 80 Mbps | 10 Mb | 10 Mb | 10 Mb | 10 Mb | 10 Mb | 10 Mb | 10 Mb | 10 Mb | 10 Mb | 10 Mb |
| 70 Mbps | 10 Mb | 10 Mb | 10 Mb | 10 Mb | 10 Mb | 10 Mb | 10 Mb | 10 Mb | 10 Mb | 10 Mb |
| 60 Mbps | 10 Mb | 10 Mb | 10 Mb | 10 Mb | 10 Mb | 10 Mb | 10 Mb | 10 Mb | 10 Mb | 10 Mb |
| 50 Mbps | 10 Mb | 10 Mb | 10 Mb | 10 Mb | 10 Mb | 10 Mb | 10 Mb | 10 Mb | 10 Mb | 10 Mb |
| 40 Mbps | 10 Mb | 10 Mb | 10 Mb | 10 Mb | 10 Mb | 10 Mb | 10 Mb | 10 Mb | 10 Mb | 10 Mb |
| 30 Mbps | 10 Mb | 10 Mb | 10 Mb | 10 Mb | 10 Mb | 10 Mb | 10 Mb | 10 Mb | 10 Mb | 10 Mb |
| 20 Mbps | 10 Mb | 10 Mb | 10 Mb | 10 Mb | 10 Mb | 10 Mb | 10 Mb | 10 Mb | 10 Mb | 10 Mb |
| 10 Mbps | 10 Mb | 10 Mb | 10 Mb | 10 Mb | 10 Mb | 10 Mb | 10 Mb | 10 Mb | 10 Mb | 10 Mb |
| Interval Spacing | 1.0 Sec | 1.0 Sec | 1.0 Sec | 1.0 Sec | 1.0 Sec | 1.0 Sec | 1.0 Sec | 1.0 Sec | 1.0 Sec | 1.0 Sec |
| Interval Number | 1st | 2nd | 3rd | 4th | 5th | 6th | 7th | 8th | 9th | 10th |
Let's see how the data moves in our ‘ideal' network when the interval spacing becomes shorter. Again, we're assuming the video traffic is evenly distributed throughout the entire interval.
The table below shows the same traffic from the above graph, but with the shorter time interval of a tenth of a second (0.1 second), instead of one second. It is important to notice the data speed of the video traffic remains at 50 Mbps in each tenth of a second time interval. This is known as True Constant Bit Rate (not to be confused with the Constant Bit Rate encoding of video compression standards to be discussed later), because the data sent are so evenly spread out throughout the entire time interval such that the data speed measured in shorter time intervals are the same as when measured with the longer original time interval.
| Total Data for current + all previous time intervals | 5 Mb | 10 Mb | 15 Mb | 20 Mb | 25 Mb | 30 Mb | 35 Mb | 40 Mb | 45 Mb | 50 Mb |
| Total Data for current time interval | 5 Mb | 5 Mb | 5 Mb | 5 Mb | 5 Mb | 5 Mb | 5 Mb | 5 Mb | 5 Mb | 5 Mb |
| 100 Mbps | 1 Mb | 1 Mb | 1 Mb | 1 Mb | 1 Mb | 1 Mb | 1 Mb | 1 Mb | 1 Mb | 1 Mb |
| 90 Mbps | 1 Mb | 1 Mb | 1 Mb | 1 Mb | 1 Mb | 1 Mb | 1 Mb | 1 Mb | 1 Mb | 1 Mb |
| 80 Mbps | 1 Mb | 1 Mb | 1 Mb | 1 Mb | 1 Mb | 1 Mb | 1 Mb | 1 Mb | 1 Mb | 1 Mb |
| 70 Mbps | 1 Mb | 1 Mb | 1 Mb | 1 Mb | 1 Mb | 1 Mb | 1 Mb | 1 Mb | 1 Mb | 1 Mb |
| 60 Mbps | 1 Mb | 1 Mb | 1 Mb | 1 Mb | 1 Mb | 1 Mb | 1 Mb | 1 Mb | 1 Mb | 1 Mb |
| 50 Mbps | 1 Mb | 1 Mb | 1 Mb | 1 Mb | 1 Mb | 1 Mb | 1 Mb | 1 Mb | 1 Mb | 1 Mb |
| 40 Mbps | 1 Mb | 1 Mb | 1 Mb | 1 Mb | 1 Mb | 1 Mb | 1 Mb | 1 Mb | 1 Mb | 1 Mb |
| 30 Mbps | 1 Mb | 1 Mb | 1 Mb | 1 Mb | 1 Mb | 1 Mb | 1 Mb | 1 Mb | 1 Mb | 1 Mb |
| 20 Mbps | 1 Mb | 1 Mb | 1 Mb | 1 Mb | 1 Mb | 1 Mb | 1 Mb | 1 Mb | 1 Mb | 1 Mb |
| 10 Mbps | 1 Mb | 1 Mb | 1 Mb | 1 Mb | 1 Mb | 1 Mb | 1 Mb | 1 Mb | 1 Mb | 1 Mb |
| Interval Spacing | 0.1 Sec | 0.1 Sec | 0.1 Sec | 0.1 Sec | 0.1 Sec | 0.1 Sec | 0.1 Sec | 0.1 Sec | 0.1 Sec | 0.1 Sec |
| Interval Number | 1st | 2nd | 3rd | 4th | 5th | 6th | 7th | 8th | 9th | 10th |
The below table gets us one step closer to showing how data actually moves. Instead of the video data being sent evenly throughout the entire time interval, the table below illustrates video data sent at alternate shorter time intervals, at 100 Mbps in 5 different tenth of a second intervals. Notice that the data speed now alternates between 100 Mbps and 0 Mbps at different tenth of a second (0.1 second) intervals. This is known as bursty bandwidth because the data sent are no longer evenly distributed throughout the entire time interval, and the data speed measured in shorter time intervals are faster than the data speed when measured with the longer original time interval.
| Total Data for current + all previous time intervals | 10 Mb | 20 Mb | 30 Mb | 40 Mb | 50 Mb | |||||
| Total Data for current time interval | 10 Mb | 0 Mb | 10 Mb | 0 Mb | 10 Mb | 0 Mb | 10 Mb | 0 Mb | 10 Mb | 0 Mb |
| 100 Mbps | 10 Mb | 10 Mb | 10 Mb | 10 Mb | 10 Mb | 10 Mb | 10 Mb | 10 Mb | 10 Mb | 10 Mb |
| 90 Mbps | 9 Mb | 9 Mb | 9 Mb | 9 Mb | 9 Mb | 9 Mb | 9 Mb | 9 Mb | 9 Mb | 9 Mb |
| 80 Mbps | 8 Mb | 8 Mb | 8 Mb | 8 Mb | 8 Mb | 8 Mb | 8 Mb | 8 Mb | 8 Mb | 8 Mb |
| 70 Mbps | 7 Mb | 7 Mb | 7 Mb | 7 Mb | 7 Mb | 7 Mb | 7 Mb | 7 Mb | 7 Mb | 7 Mb |
| 60 Mbps | 6 Mb | 6 Mb | 6 Mb | 6 Mb | 6 Mb | 6 Mb | 6 Mb | 6 Mb | 6 Mb | 6 Mb |
| 50 Mbps | 5 Mb | 5 Mb | 5 Mb | 5 Mb | 5 Mb | 5 Mb | 5 Mb | 5 Mb | 5 Mb | 5 Mb |
| 40 Mbps | 4 Mb | 4 Mb | 4 Mb | 4 Mb | 4 Mb | 4 Mb | 4 Mb | 4 Mb | 4 Mb | 4 Mb |
| 30 Mbps | 3 Mb | 3 Mb | 3 Mb | 3 Mb | 3 Mb | 3 Mb | 3 Mb | 3 Mb | 3 Mb | 3 Mb |
| 20 Mbps | 2 Mb | 2 Mb | 2 Mb | 2 Mb | 2 Mb | 2 Mb | 2 Mb | 2 Mb | 2 Mb | 2 Mb |
| 10 Mbps | 1 Mb | 1 Mb | 1 Mb | 1 Mb | 1 Mb | 1 Mb | 1 Mb | 1 Mb | 1 Mb | 1 Mb |
| Interval Spacing | 0.1 Sec | 0.1 Sec | 0.1 Sec | 0.1 Sec | 0.1 Sec | 0.1 Sec | 0.1 Sec | 0.1 Sec | 0.1 Sec | 0.1 Sec |
| Interval Number | 1st | 2nd | 3rd | 4th | 5th | 6th | 7th | 8th | 9th | 10th |
The above examples are for illustration purposes only. In reality, we should be using a much finer time interval than the tenth of a second interval used, in order to capture the burstiness of any traffic. If above example were a real case, because the wire speed is at 100 Mbps, we would be using the finer time interval of one-hundredth of a second, instead of the tenth of a second interval.
■ All Traffic Tends To Be Bursty
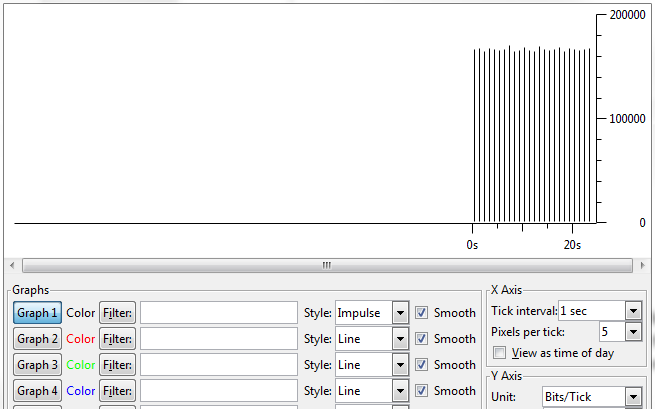
All traffic is bursty and by looking at data over different time intervals, we can start to see bursts. Below is a graphical analysis of Ping traffic on a 100 Mbps network from a packet analyzer. The Ping traffic was carrying 10 kilobytes of buffer data. As the graph shows, with the normal one second as the time interval, the Ping traffic is shown to be sent at 160 Kbps (0.16 Mbps) average data speed. This is accurate, since the 20KB of roundtrip Ping data results in 13.5 full sized Ethernet packets (13.5 * 12304 bits = 160,104 bits, or 0.16 Megabits).
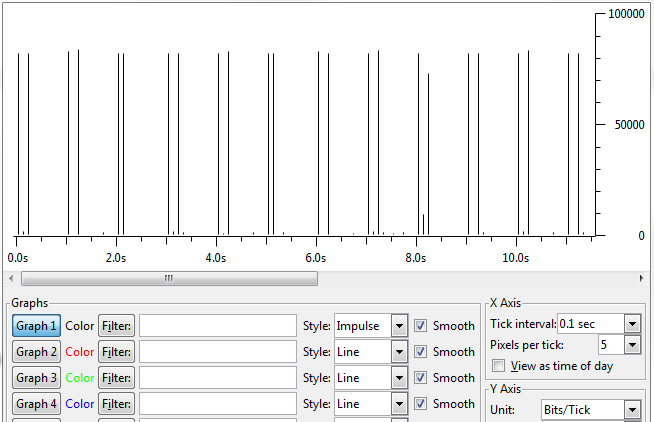
However, as the graph below shows, if we only look at the 0.16 Megabits of Ping data from the first full second time interval of the previous graph, but using a smaller time interval of a tenth of a second (0.1 second), we will see that the same 0.16 Megabits of Ping data are sent at 800 Kbps (0.8 Mbps) in 2 different tenths of a second time intervals (1st & 3rd, one is the Ping request and the other is the reply), with 0.08-Megabits of burst data in each time interval. Thus, we can see that the Ping data is beginning to look rather bursty.
Since the wire speed is 100 Mbps, in order to truly characterize the burstiness of the Ping traffic, we must go down even further to one hundredth (0.01 Sec) of a second time interval. As the graph below shows, at the time interval of one hundredth of a second (0.01 second), the true burst speed of the very same 0.16 Megabits of Ping data are now revealed to be sent at 8 Mbps in 2 different hundredth of a second time intervals (1st & 26th, one is the Ping request and the other is the reply), with the same 0.08-Megabits of burst data in each time interval.
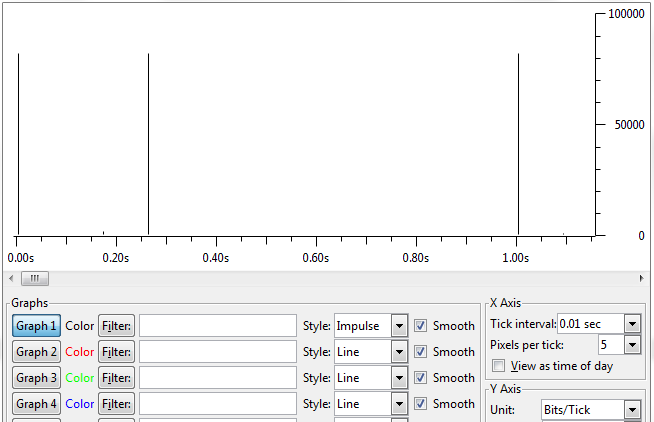
The reason for the increase in burst speed between the last two graphs is due to the fact that the tenth of a second-time interval used in the one graph was too coarse for measuring these two microbursts. By using the finer time interval of hundredth of a second, the above graph is able to measure the true burstiness of these two microbursts.
■ Video Traffic is Bursty by Design
Video traffic is bursty in a way that is different from normal traffic due to a technique called Temporal Compression. This technique uses motion prediction to create two types of video frames: Key frames and Delta frames. Key frames contain all the picture information necessary to form a complete picture. Delta frames on the other hand only contain partial picture information, not enough to form a complete picture, it will depend on the previous Key frame to fill in the gaps in order to form a complete picture. Any temporally compressed video traffic will then be consisting of a combination of Key frame packets and Delta frame packets, with the majority being Delta frame packets. This translates into video traffic that's bursty by design, with periodic bursts coming from Key frame packets.
Below is a graph from a packet analyzer showing captured video packets from a 10 Megapixel camera on a 100 Mbps network. We will be looking at the video data around the 25th time interval in this graph and use it as our reference throughout the remainder of this discussion. As the graph shows, with the normal one second as the time interval, the video traffic at the 25th time interval is shown to be sent at 5 Mbps average data speed.
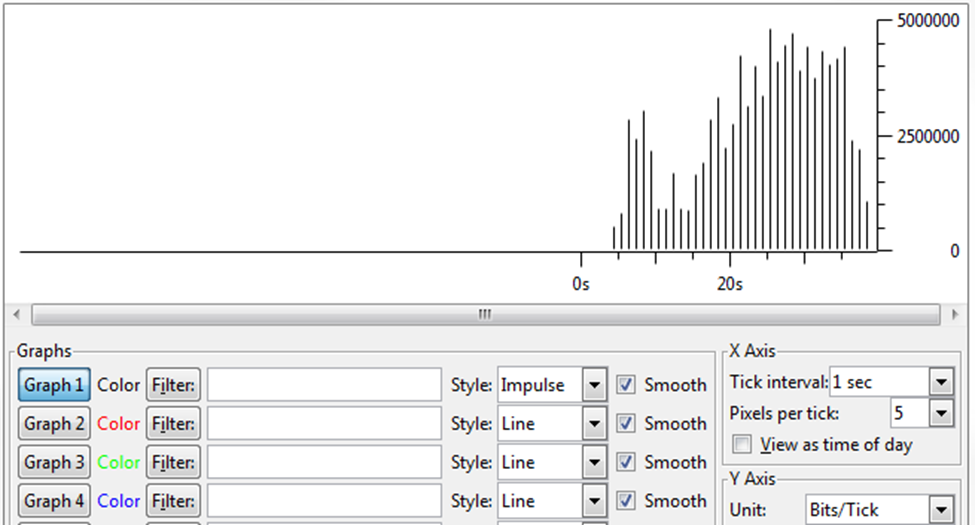
If we look at the same video data using a time interval of a tenth of a second (0.1 second) instead of the normal one-second interval, we will see video data is now shown to be sent at 8 Mbps.
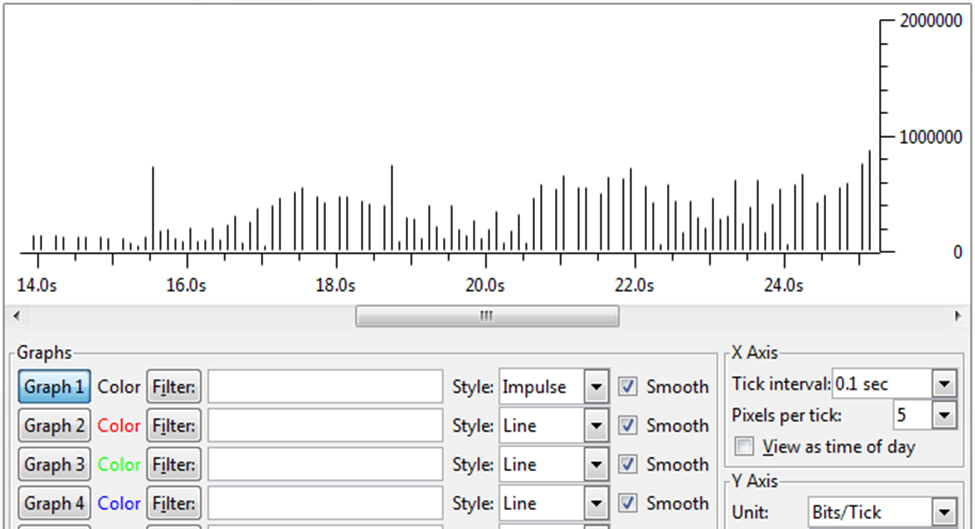
Since the wire speed is 100 Mbps, the best practice is to use one hundredth (0.01 Sec) of a second as the time interval to characterize the burstiness. As the graph below shows, at the time interval of one-hundredth of a second (0.01 second), the true burst speed of this video data is now revealed to be at 25 Mbps.
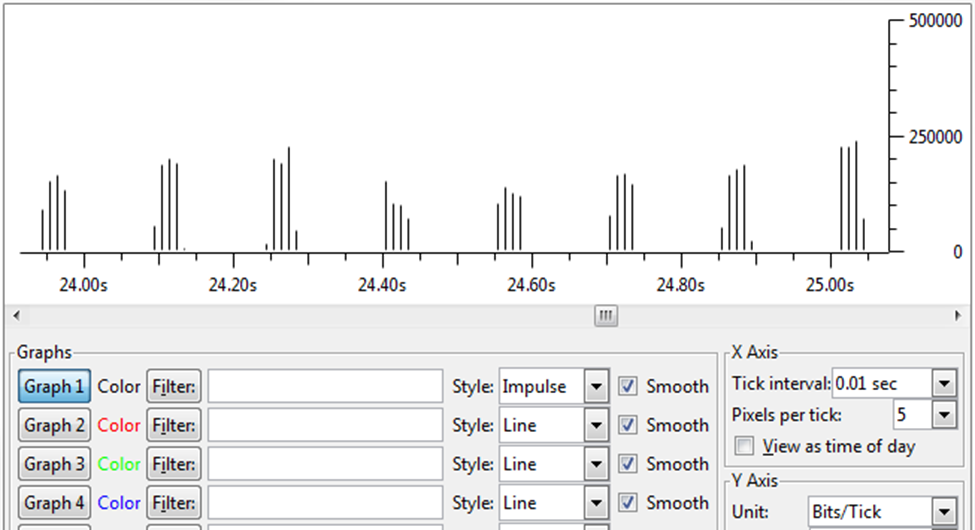
The above example of video burst is very typical of video traffic in general. In general, video traffic will usually burst at a data speed that is 5 to 6 times the quoted average video bandwidth.
■ The Illusion of Average Video Bandwidth
In the beginning, we discussed how video bandwidth is quoted in terms of Megabits per second, and that this expression can cause problems because the expression gives us the illusion that we can build and design a video network around the data speed quoted. The two examples below will illustrate this, using two cameras instead of just one.
Assuming again our network runs at 100 Mbps, and each camera can produce video data at 50 Mbps. We further assume that both cameras can output video data at True Constant Bit Rate. The table below shows what the shape of the video traffic would look like for both cameras combined, using the time interval of a tenth of a second (0.1 second). Video data from each camera are represented by cell with different colors. For illustration purposes only, this scenario should not cause any issues on the network.
| Total Data for current + all previous time intervals | 10 Mb | 20 Mb | 30 Mb | 40 Mb | 50 Mb | 60 Mb | 70 Mb | 80 Mb | 90 Mb | 100 Mb |
| Total Data for current time interval | 10 Mb | 10 Mb | 10 Mb | 10 Mb | 10 Mb | 10 Mb | 10 Mb | 10 Mb | 10 Mb | 10 Mb |
| 100 Mbps | 1 Mb | 1 Mb | 1 Mb | 1 Mb | 1 Mb | 1 Mb | 1 Mb | 1 Mb | 1 Mb | 1 Mb |
| 90 Mbps | 1 Mb | 1 Mb | 1 Mb | 1 Mb | 1 Mb | 1 Mb | 1 Mb | 1 Mb | 1 Mb | 1 Mb |
| 80 Mbps | 1 Mb | 1 Mb | 1 Mb | 1 Mb | 1 Mb | 1 Mb | 1 Mb | 1 Mb | 1 Mb | 1 Mb |
| 70 Mbps | 1 Mb | 1 Mb | 1 Mb | 1 Mb | 1 Mb | 1 Mb | 1 Mb | 1 Mb | 1 Mb | 1 Mb |
| 60 Mbps | 1 Mb | 1 Mb | 1 Mb | 1 Mb | 1 Mb | 1 Mb | 1 Mb | 1 Mb | 1 Mb | 1 Mb |
| 50 Mbps | 1 Mb | 1 Mb | 1 Mb | 1 Mb | 1 Mb | 1 Mb | 1 Mb | 1 Mb | 1 Mb | 1 Mb |
| 40 Mbps | 1 Mb | 1 Mb | 1 Mb | 1 Mb | 1 Mb | 1 Mb | 1 Mb | 1 Mb | 1 Mb | 1 Mb |
| 30 Mbps | 1 Mb | 1 Mb | 1 Mb | 1 Mb | 1 Mb | 1 Mb | 1 Mb | 1 Mb | 1 Mb | 1 Mb |
| 20 Mbps | 1 Mb | 1 Mb | 1 Mb | 1 Mb | 1 Mb | 1 Mb | 1 Mb | 1 Mb | 1 Mb | 1 Mb |
| 10 Mbps | 1 Mb | 1 Mb | 1 Mb | 1 Mb | 1 Mb | 1 Mb | 1 Mb | 1 Mb | 1 Mb | 1 Mb |
| Interval Spacing | 0.1 Sec | 0.1 Sec | 0.1 Sec | 0.1 Sec | 0.1 Sec | 0.1 Sec | 0.1 Sec | 0.1 Sec | 0.1 Sec | 0.1 Sec |
| Interval Number | 1st | 2nd | 3rd | 4th | 5th | 6th | 7th | 8th | 9th | 10th |
Let's now assume that instead of each camera outputting video data at 50 Mbps in True Constant Bit Rate, the cameras will output burst video data at 100 Mbps in 5 separate tenths of a second time intervals. The table below shows a possible traffic pattern for this scenario. Again, video data from each camera is represented by cells with different colors. Of course, this table assumes that both cameras will not output their burst data at the same time, but instead, will do so at different time intervals. If this is indeed the case, then there also should not be any issues on this network. Of course, in reality, there is no way that we can control at what time a camera will output its data. Although we cannot illustrate this in the same table format, if at any time both cameras start to output its data at the same time, then the network will immediately experience traffic congestion at that moment and suffer video loss as a consequence. The cause of this is simply due to the fact that the network at any one-tenth of a second (0.1 second) interval can only accept a maximum of 10 Mb of data (100 Mbps * 0.1 Sec = 10 Mb), whereas if both cameras are outputting its data at the same tenth of a second interval, the total amount of data on the network at that time interval would be 20 Mb.
| Total Data for current + all previous time intervals | 10 Mb | 10 Mb | 20 Mb | 20 Mb | 30 Mb | 30 Mb | 40 Mb | 40 Mb | 50 Mb | 50 Mb |
| Total Data for current time interval | 10 Mb | 10 Mb | 10 Mb | 10 Mb | 10 Mb | 10 Mb | 10 Mb | 10 Mb | 10 Mb | 10 Mb |
| 100 Mbps | 10 Mb | 10 Mb | 10 Mb | 10 Mb | 10 Mb | 10 Mb | 10 Mb | 10 Mb | 10 Mb | 10 Mb |
| 90 Mbps | 9 Mb | 9 Mb | 9 Mb | 9 Mb | 9 Mb | 9 Mb | 9 Mb | 9 Mb | 9 Mb | 9 Mb |
| 80 Mbps | 8 Mb | 8 Mb | 8 Mb | 8 Mb | 8 Mb | 8 Mb | 8 Mb | 8 Mb | 8 Mb | 8 Mb |
| 70 Mbps | 7 Mb | 7 Mb | 7 Mb | 7 Mb | 7 Mb | 7 Mb | 7 Mb | 7 Mb | 7 Mb | 7 Mb |
| 60 Mbps | 6 Mb | 6 Mb | 6 Mb | 6 Mb | 6 Mb | 6 Mb | 6 Mb | 6 Mb | 6 Mb | 6 Mb |
| 50 Mbps | 5 Mb | 5 Mb | 5 Mb | 5 Mb | 5 Mb | 5 Mb | 5 Mb | 5 Mb | 5 Mb | 5 Mb |
| 40 Mbps | 4 Mb | 4 Mb | 4 Mb | 4 Mb | 4 Mb | 4 Mb | 4 Mb | 4 Mb | 4 Mb | 4 Mb |
| 30 Mbps | 3 Mb | 3 Mb | 3 Mb | 3 Mb | 3 Mb | 3 Mb | 3 Mb | 3 Mb | 3 Mb | 3 Mb |
| 20 Mbps | 2 Mb | 2 Mb | 2 Mb | 2 Mb | 2 Mb | 2 Mb | 2 Mb | 2 Mb | 2 Mb | 2 Mb |
| 10 Mbps | 1 Mb | 1 Mb | 1 Mb | 1 Mb | 1 Mb | 1 Mb | 1 Mb | 1 Mb | 1 Mb | 1 Mb |
| Interval Spacing | 0.1 Sec | 0.1 Sec | 0.1 Sec | 0.1 Sec | 0.1 Sec | 0.1 Sec | 0.1 Sec | 0.1 Sec | 0.1 Sec | 0.1 Sec |
| Interval Number | 1st | 2nd | 3rd | 4th | 5th | 6th | 7th | 8th | 9th | 10th |
The following graph illustrates this perfectly using a real scenario. The data captured in this graph are live video data from multiple cameras on a 100 Mbps network. The network was experiencing periodic video loss at the time. As the graph below shows, using the normal one second as the time interval, all the data are shown to be sent at about 45 Mbps in average data speed. We will not be able to discover the cause of the video loss from such a high-level graph.
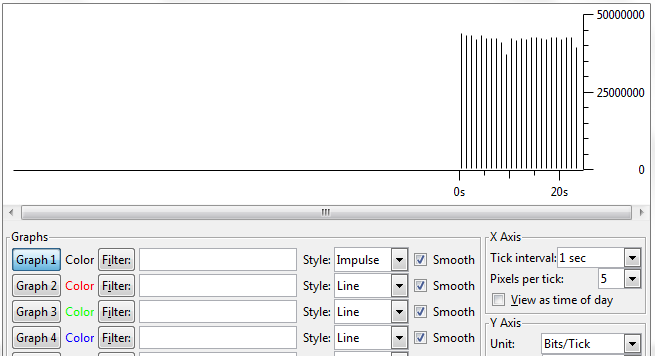
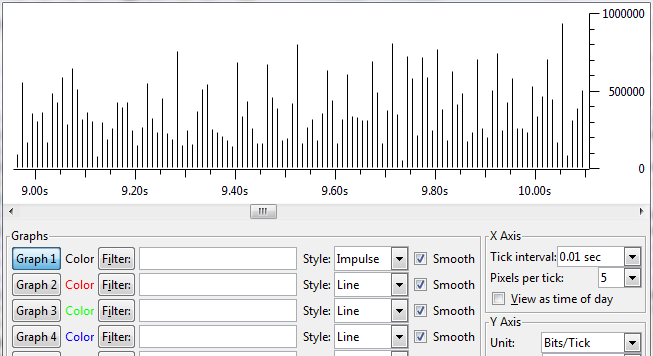
Since the wire speed is at 100 Mbps, we will use one-hundredth of a second (0.01 Sec) time interval to further examine the video traffic. As the graph below shows, we can now see numerous bursts of video data sent at extremely high data speeds (a few approaching 100 Mbps). This is most likely the cause of the video loss.
■ Conclusion
Video traffic is always bursty by nature. We should always remember this fact and take it into consideration when designing a network or implementing an application. The rule of thumb here is that whenever we hear video bandwidth being quoted in Megabits per second, convert this average video bandwidth into its true burst bandwidth through multiplication by a factor 5 or 6; and then design according to the burst bandwidth.
There are some alternatives when trying to avoid the network congestion issue caused by video burst. For example, you can try to find a camera that will use a traffic shaping mechanism to smooth out the video output to become True Constant Bit Rate. However, you must make sure that the camera really does implement a traffic shaping mechanism. Some cameras report Constant Bit Rate capability, but these solutions are based on video encoding techniques from technologies such as H.264. These compression techniques are designed with the quality of the video stream and storage in mind, and have nothing to do with true traffic shaping on a network. You should always confirm any such solution with packet capture. In short, always assume video traffic to be extremely bursty unless packet capture can prove it otherwise.
When planning network bandwidth for your future projects--especially those involving videos--always take these extra steps to ensure your network is set up for success both today and tomorrow.


